Geoprocessing in QGIS
Geoprocessing population data (Introduction to QGIS course, Part 5)
Introduction to QGIS Part 5
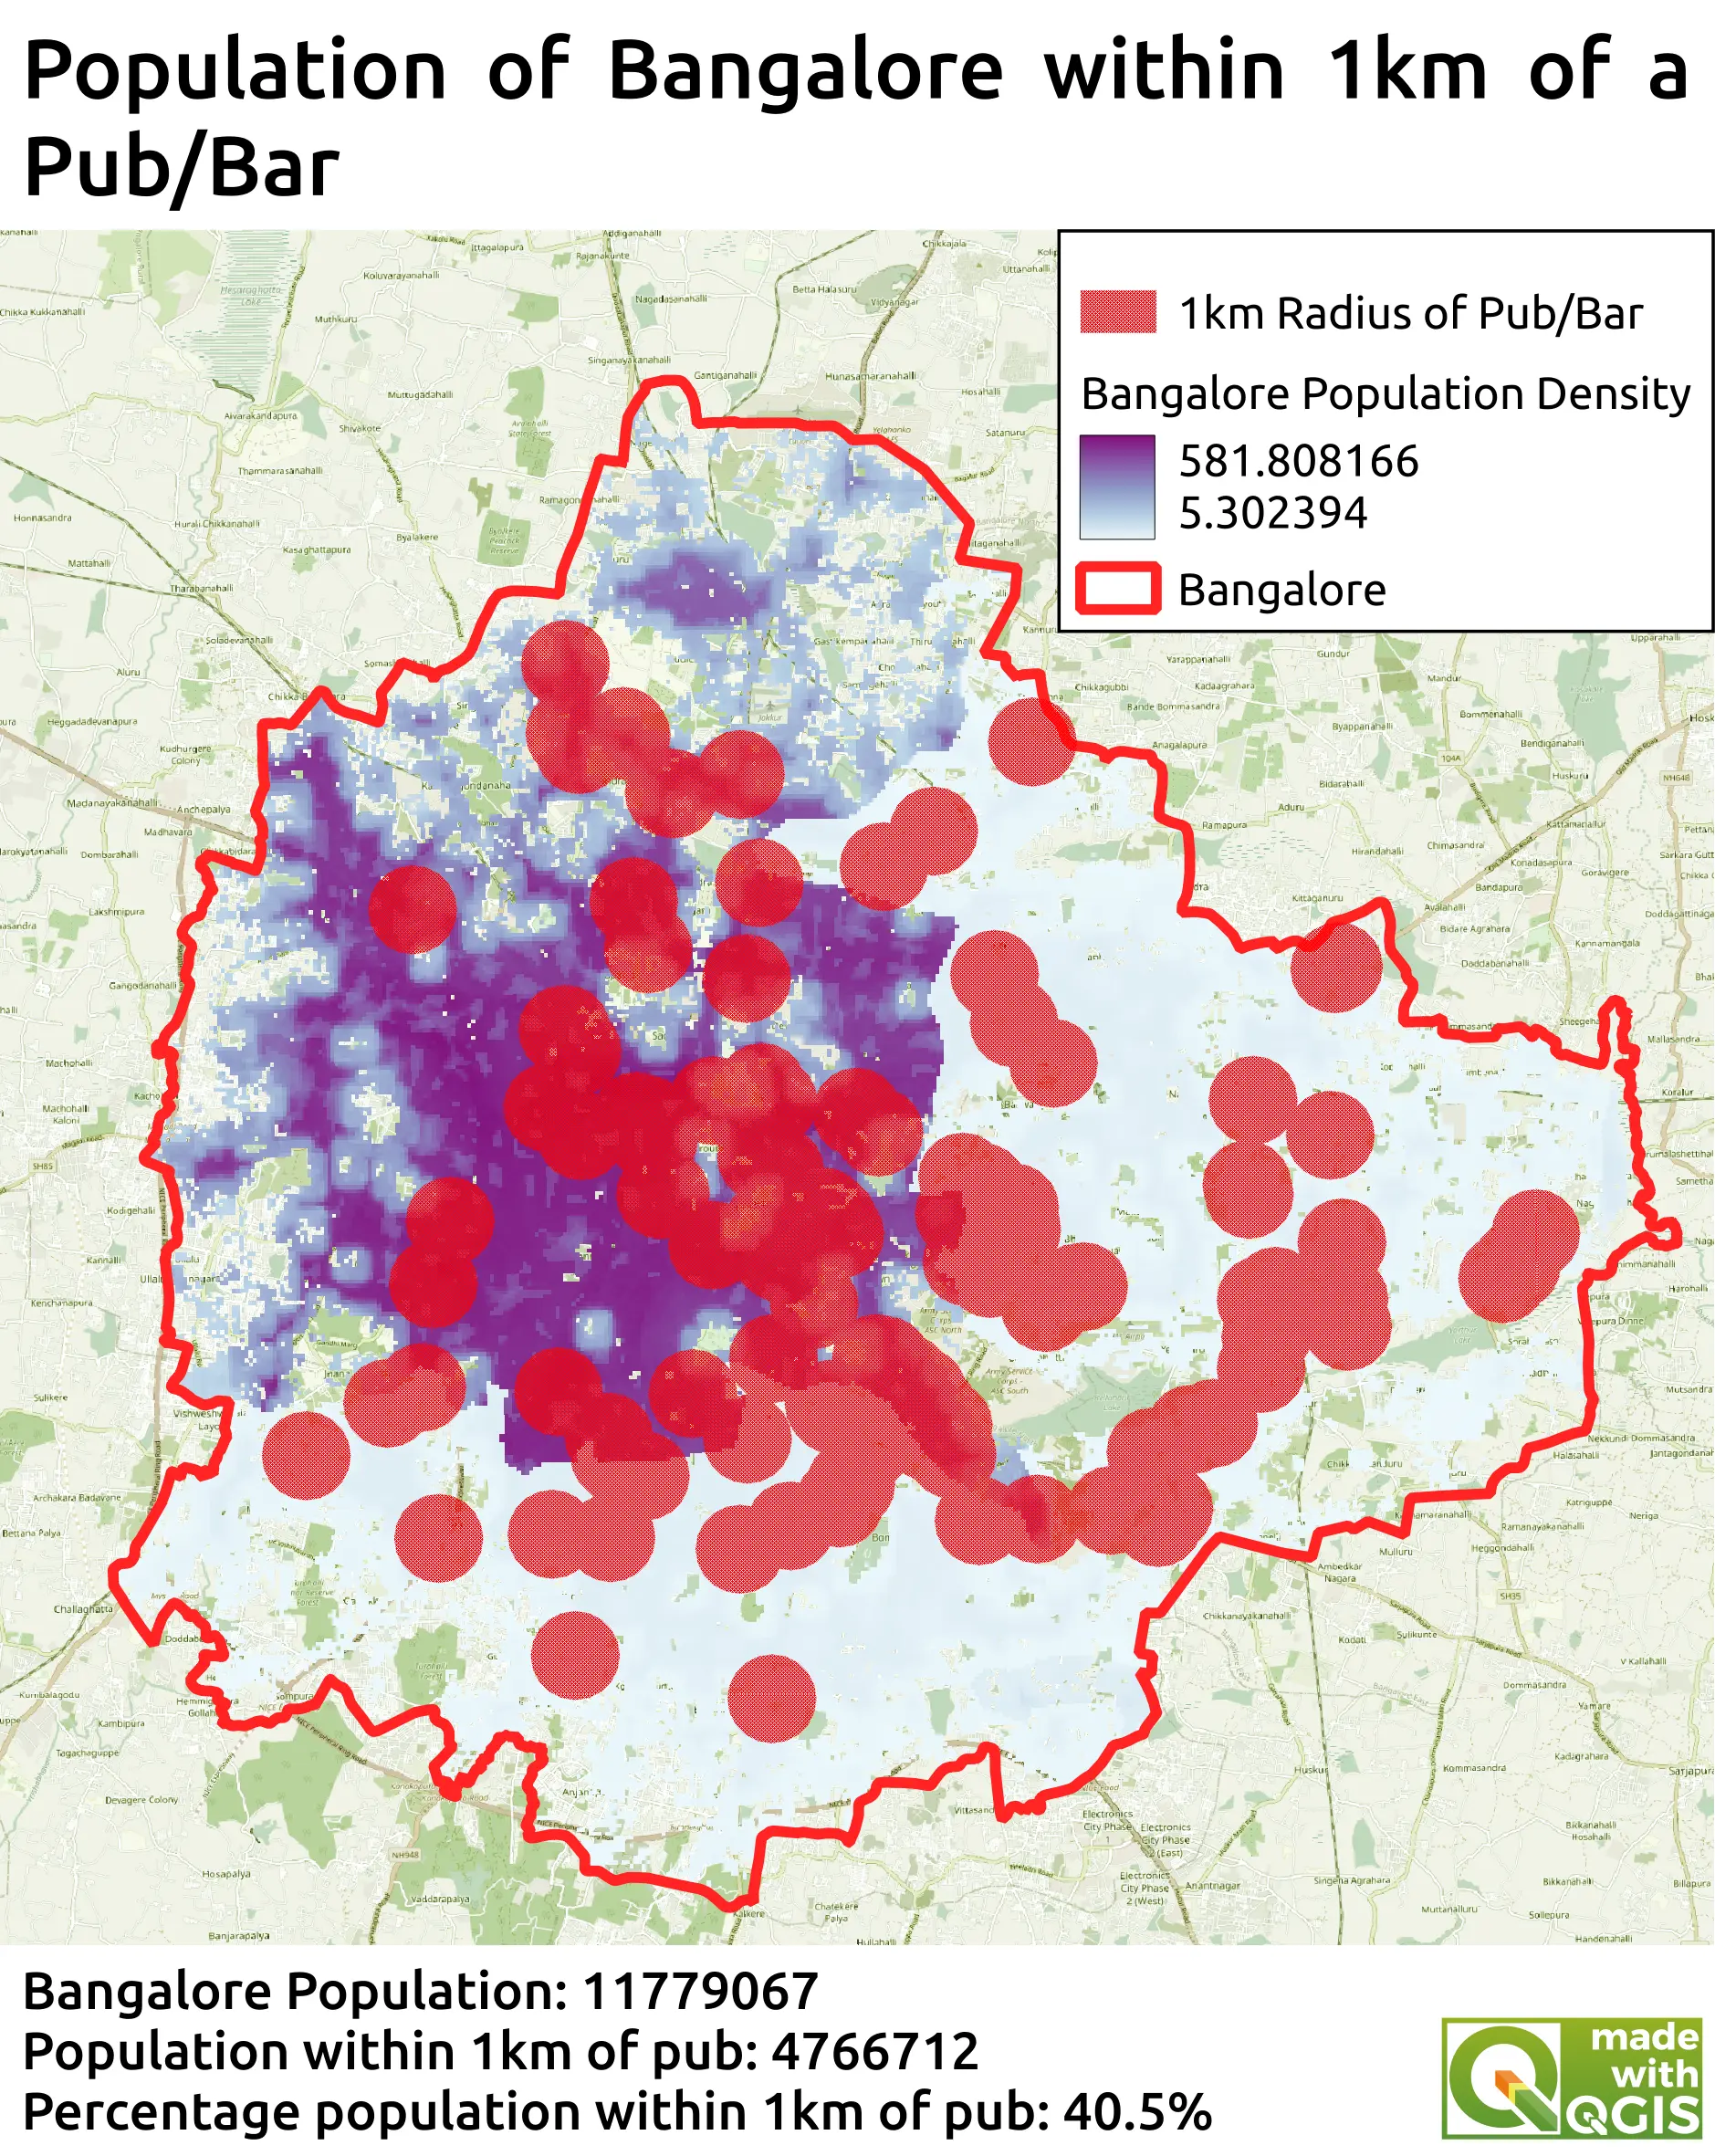
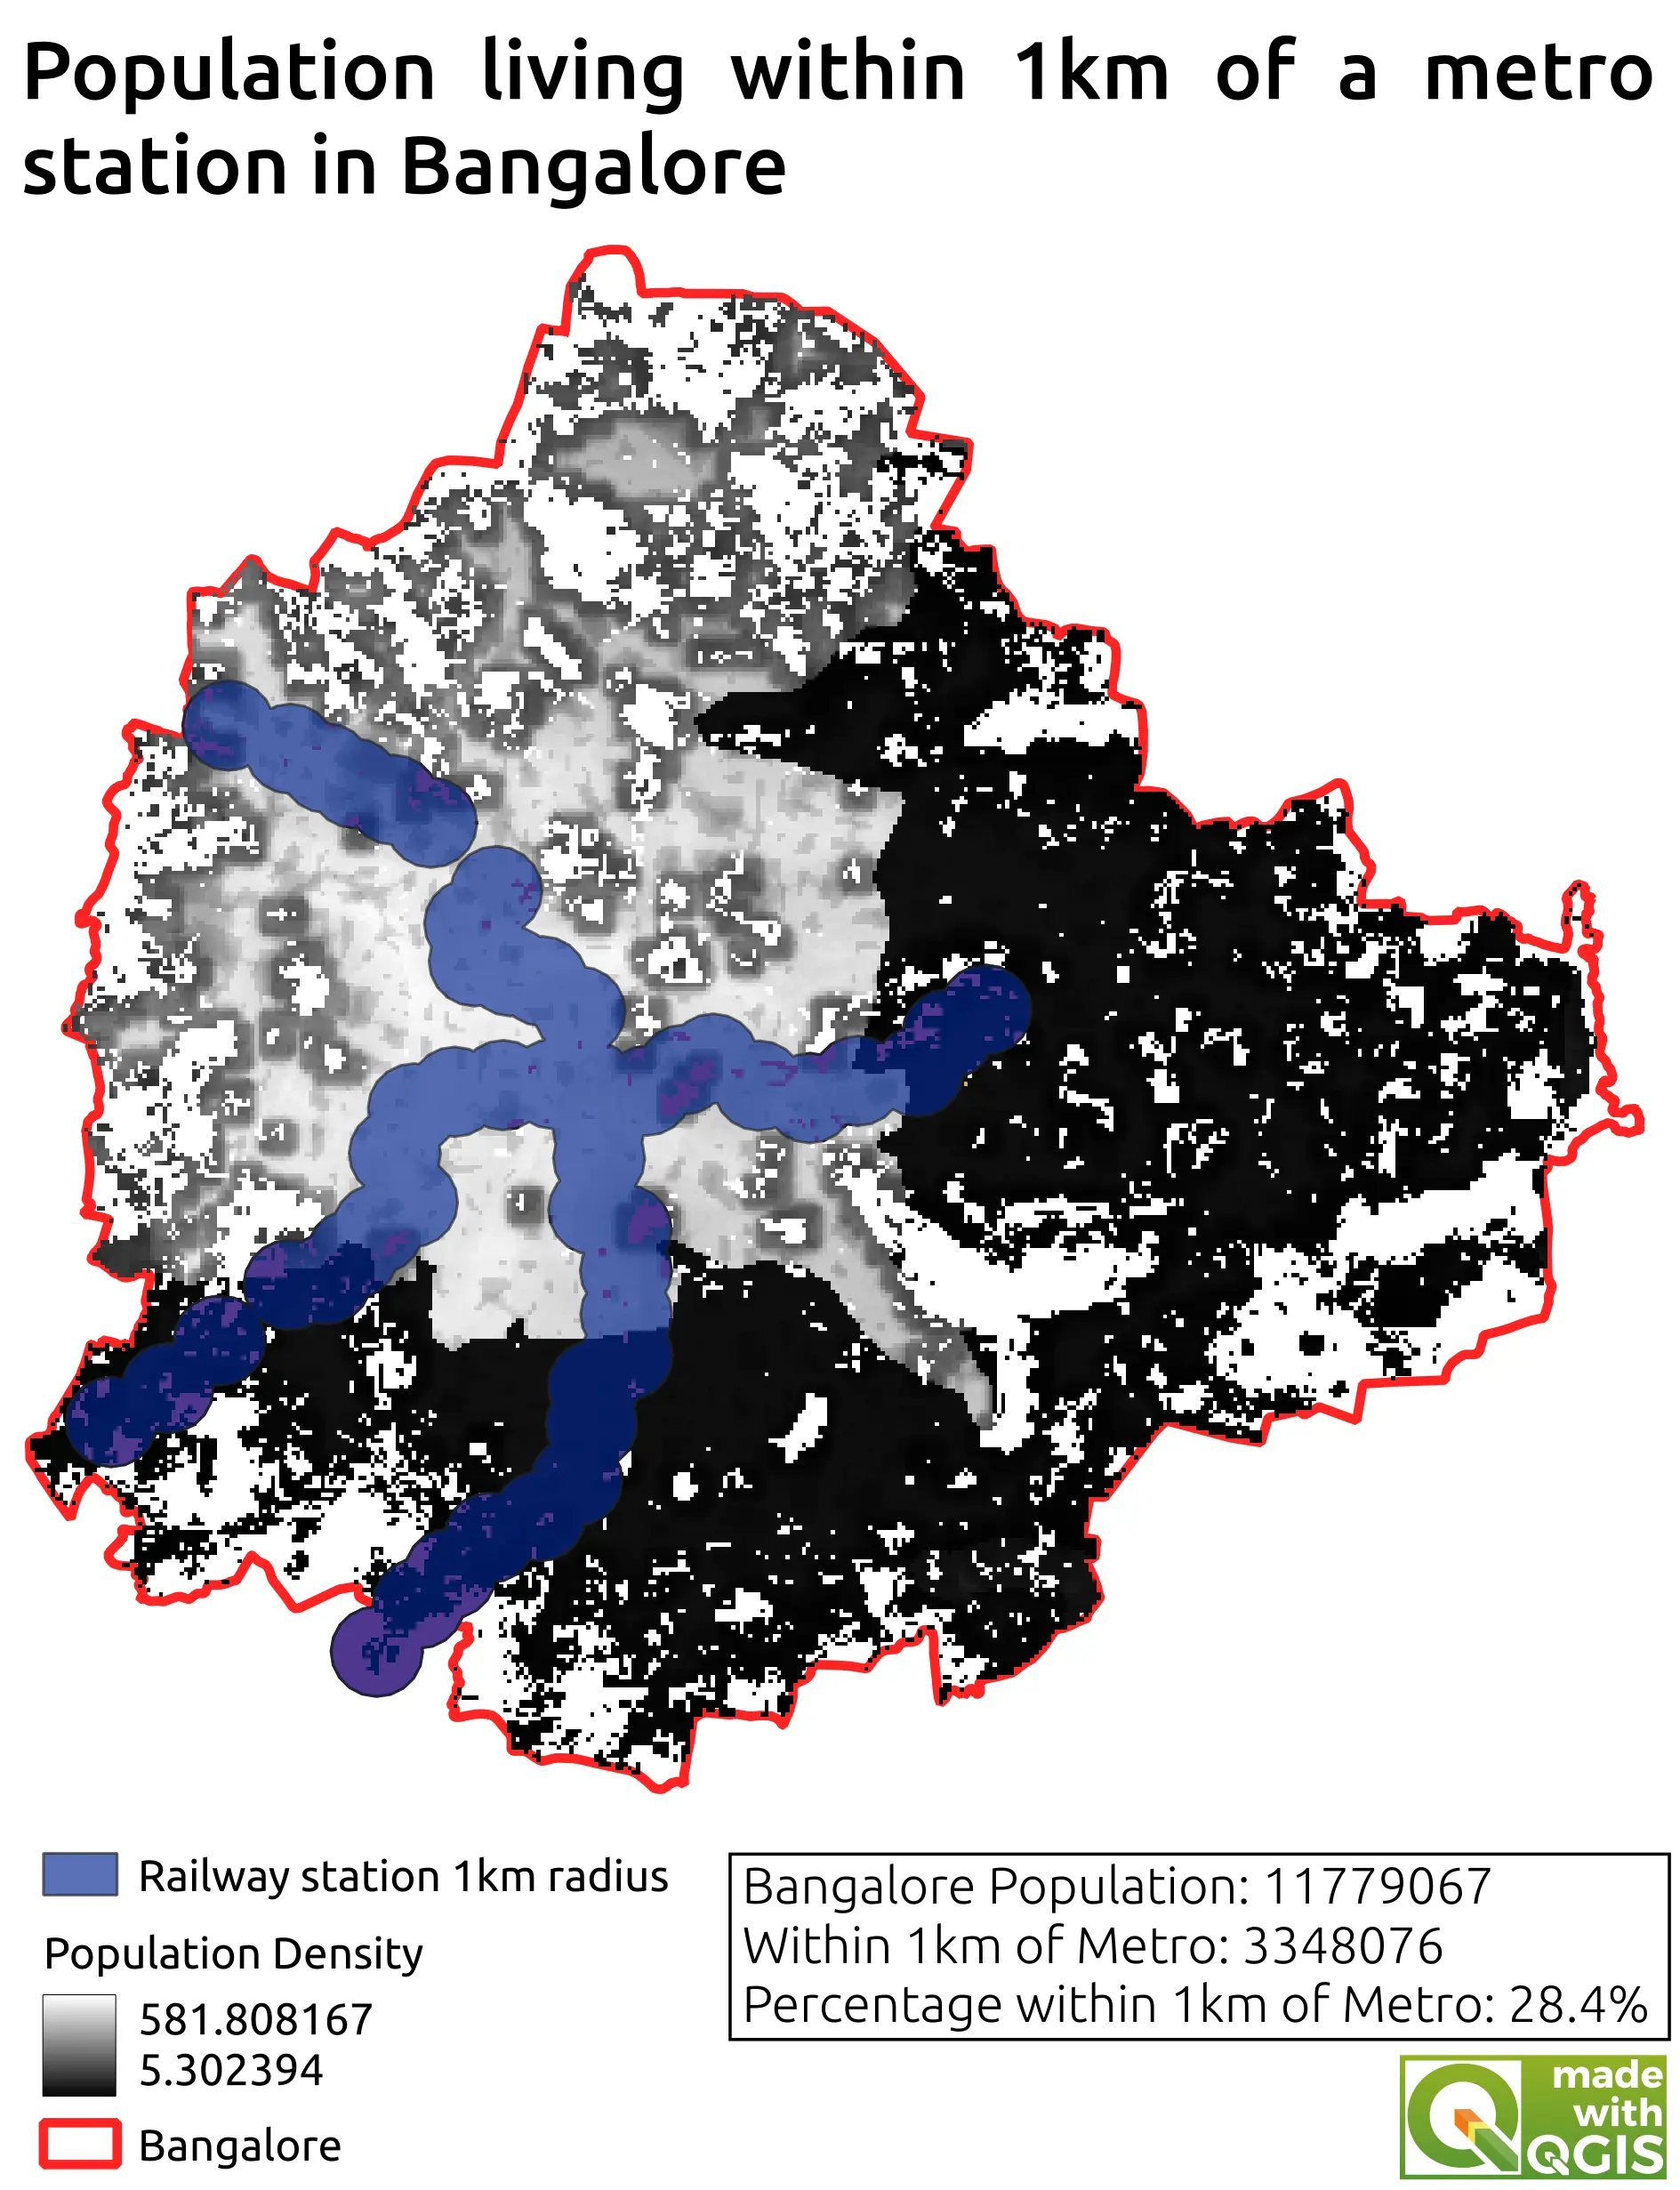
This project was part of the Introduction to QGIS course (Part 5) by Spatial Thoughts. In this section of the course, both a raster layer containing population density and data on the location of metro stations in Bangalore were used to calculate the percentage of the population of Bangalore who live within 1km of a metro station. Initially, the QuickOSM plugin was used to import the locations of metro stations within Bangalore. This data was filtered to select only the currently used stations. Subsequently, the buffer tool of the processing toolbox was used to select areas within 1km of these points and produce a new layer. In order to do this step, it was first necessary to reproject the map to a projection containing distance units rather than degrees. Once the buffer area had been obtained, it was reprojected into the original format of the file (containing angular units). Raster data with each pixel representing population density within a 100m x 100m area was then used to calculate the population within both the whole of Bangalore, and also just within the newly created layer which was within 1km of the railway. In order to calculate the population from this raster layer, the zonal statistics tool was used from the processing toolbox. The population within 1km of the railway was taken as a percentage of the total population of Bangalore. In order to practice these new skills, a new map was produced with the population within 1km of a pub/bar.