Mapping NYC Population in QGIS
Analysing NYC Population Data (Introduction to QGIS course, Part 2)
Introduction to QGIS Part 2
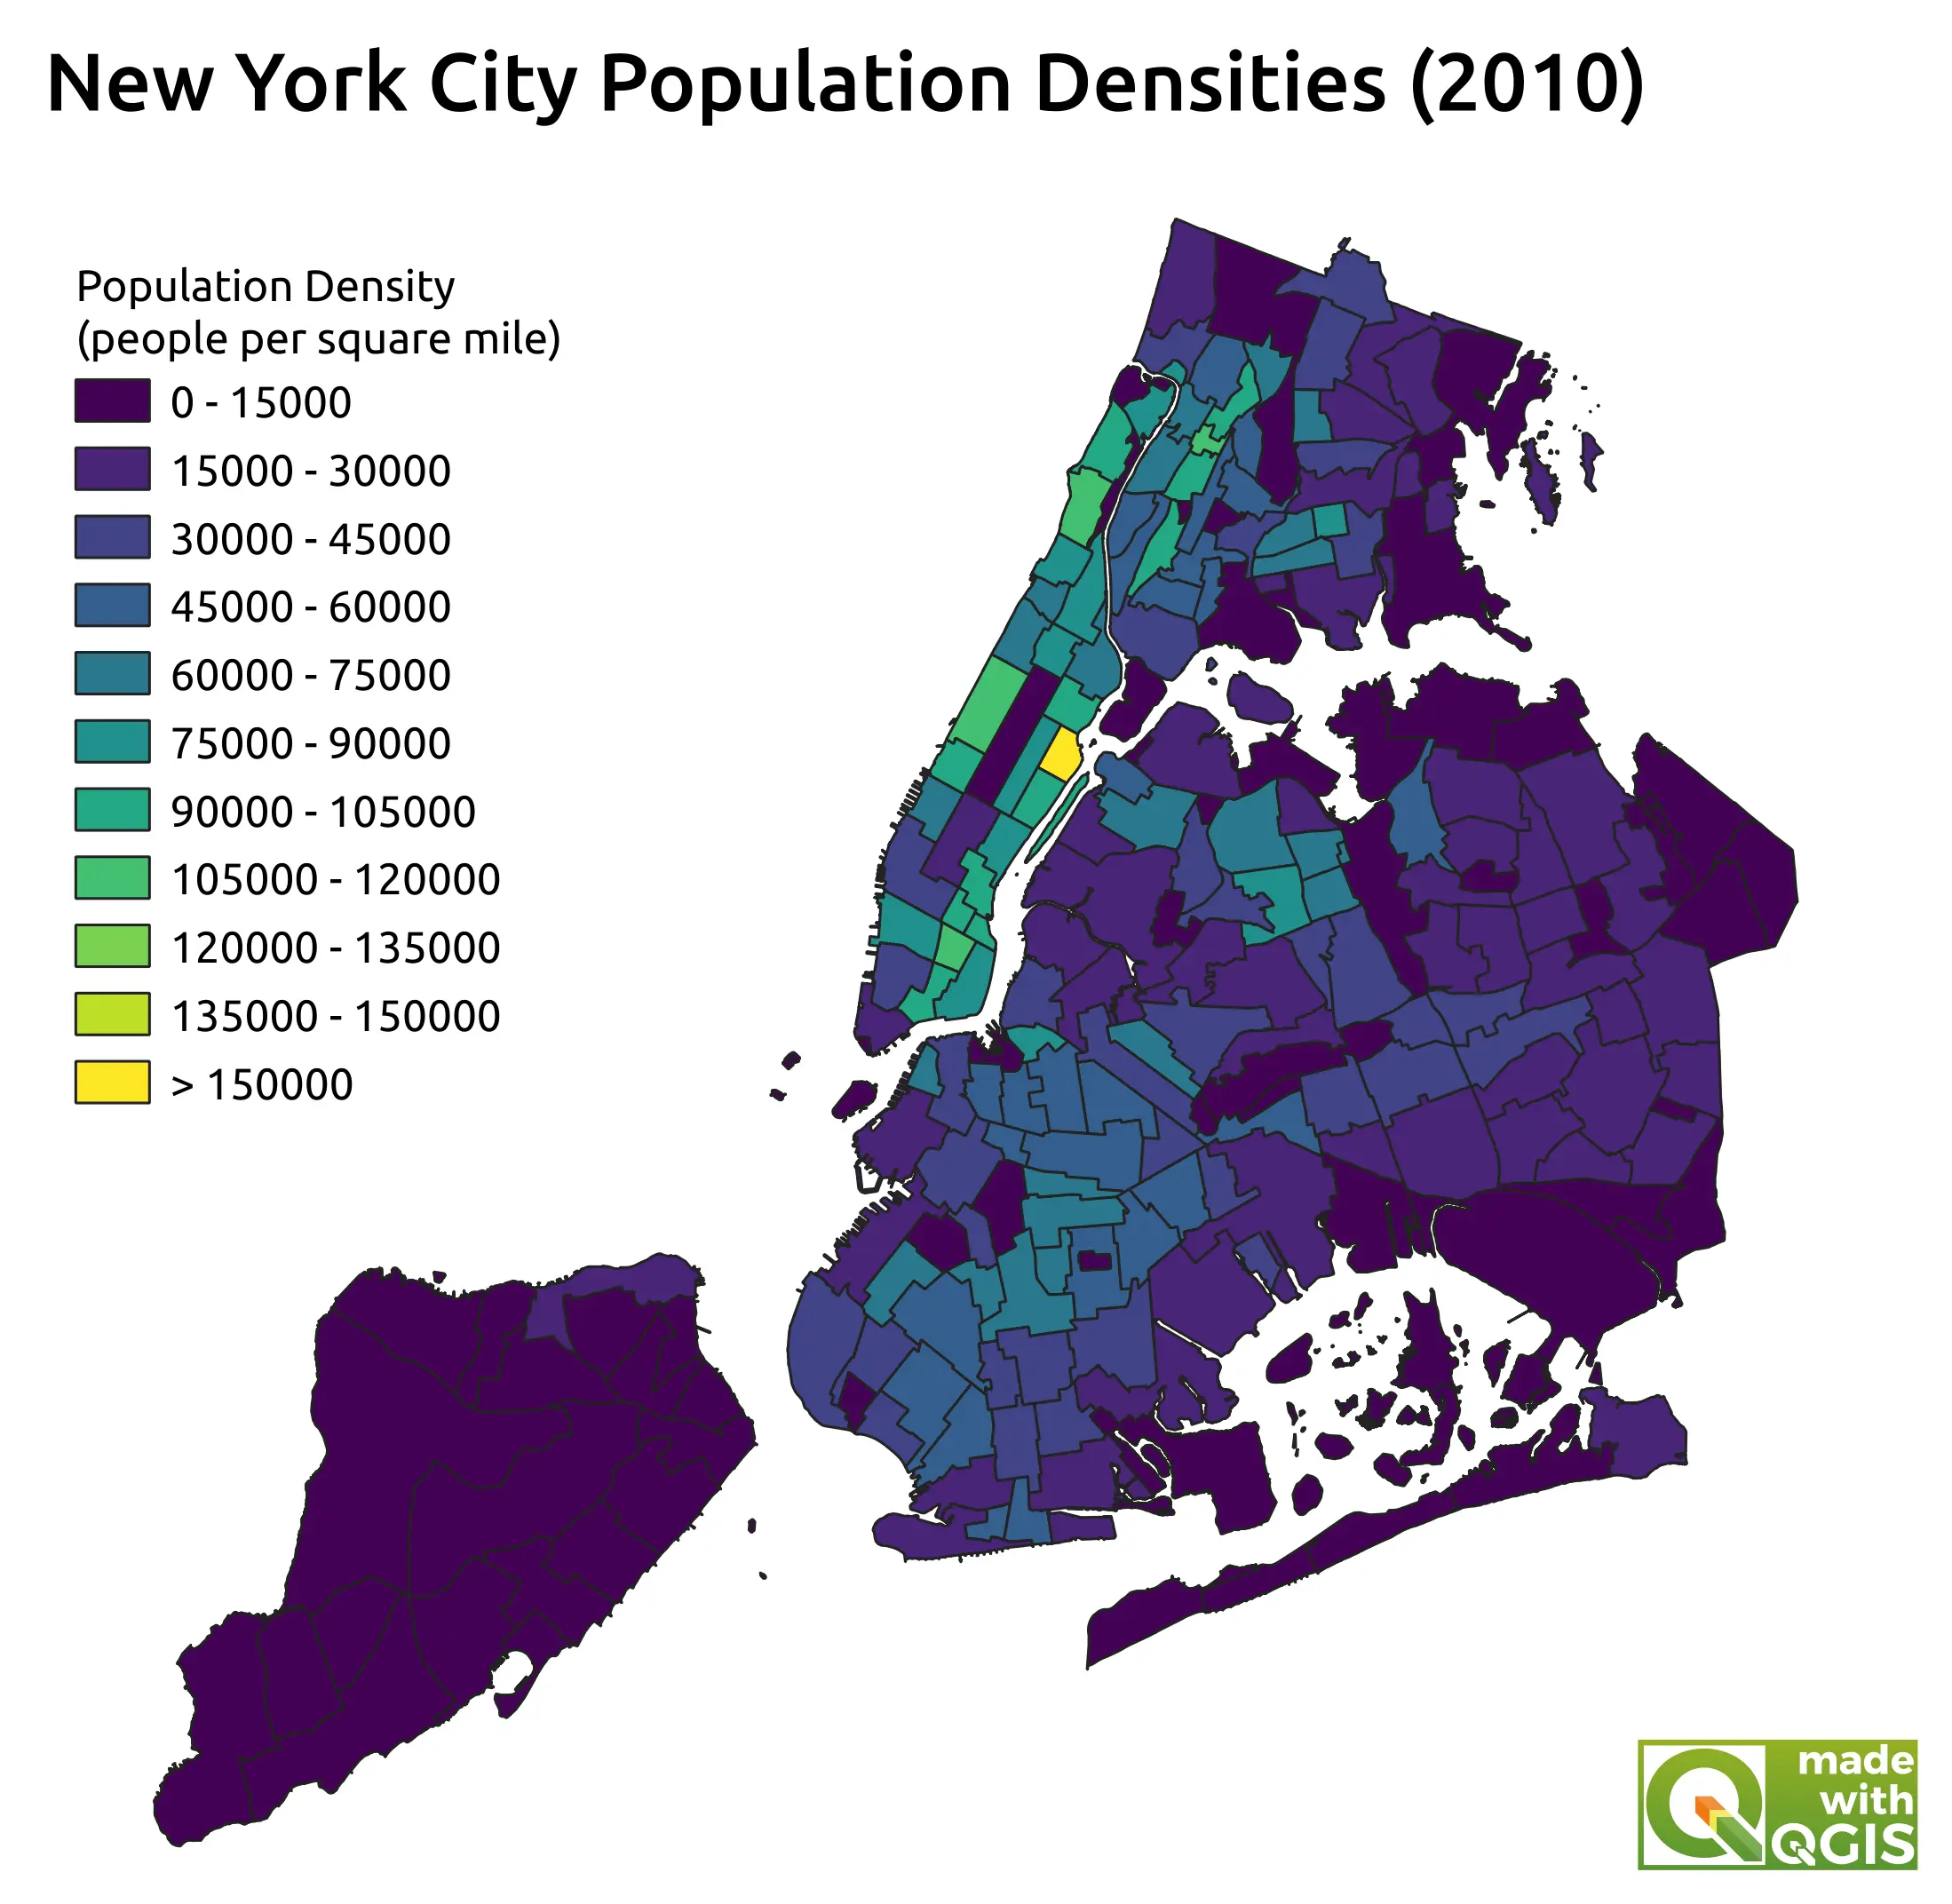
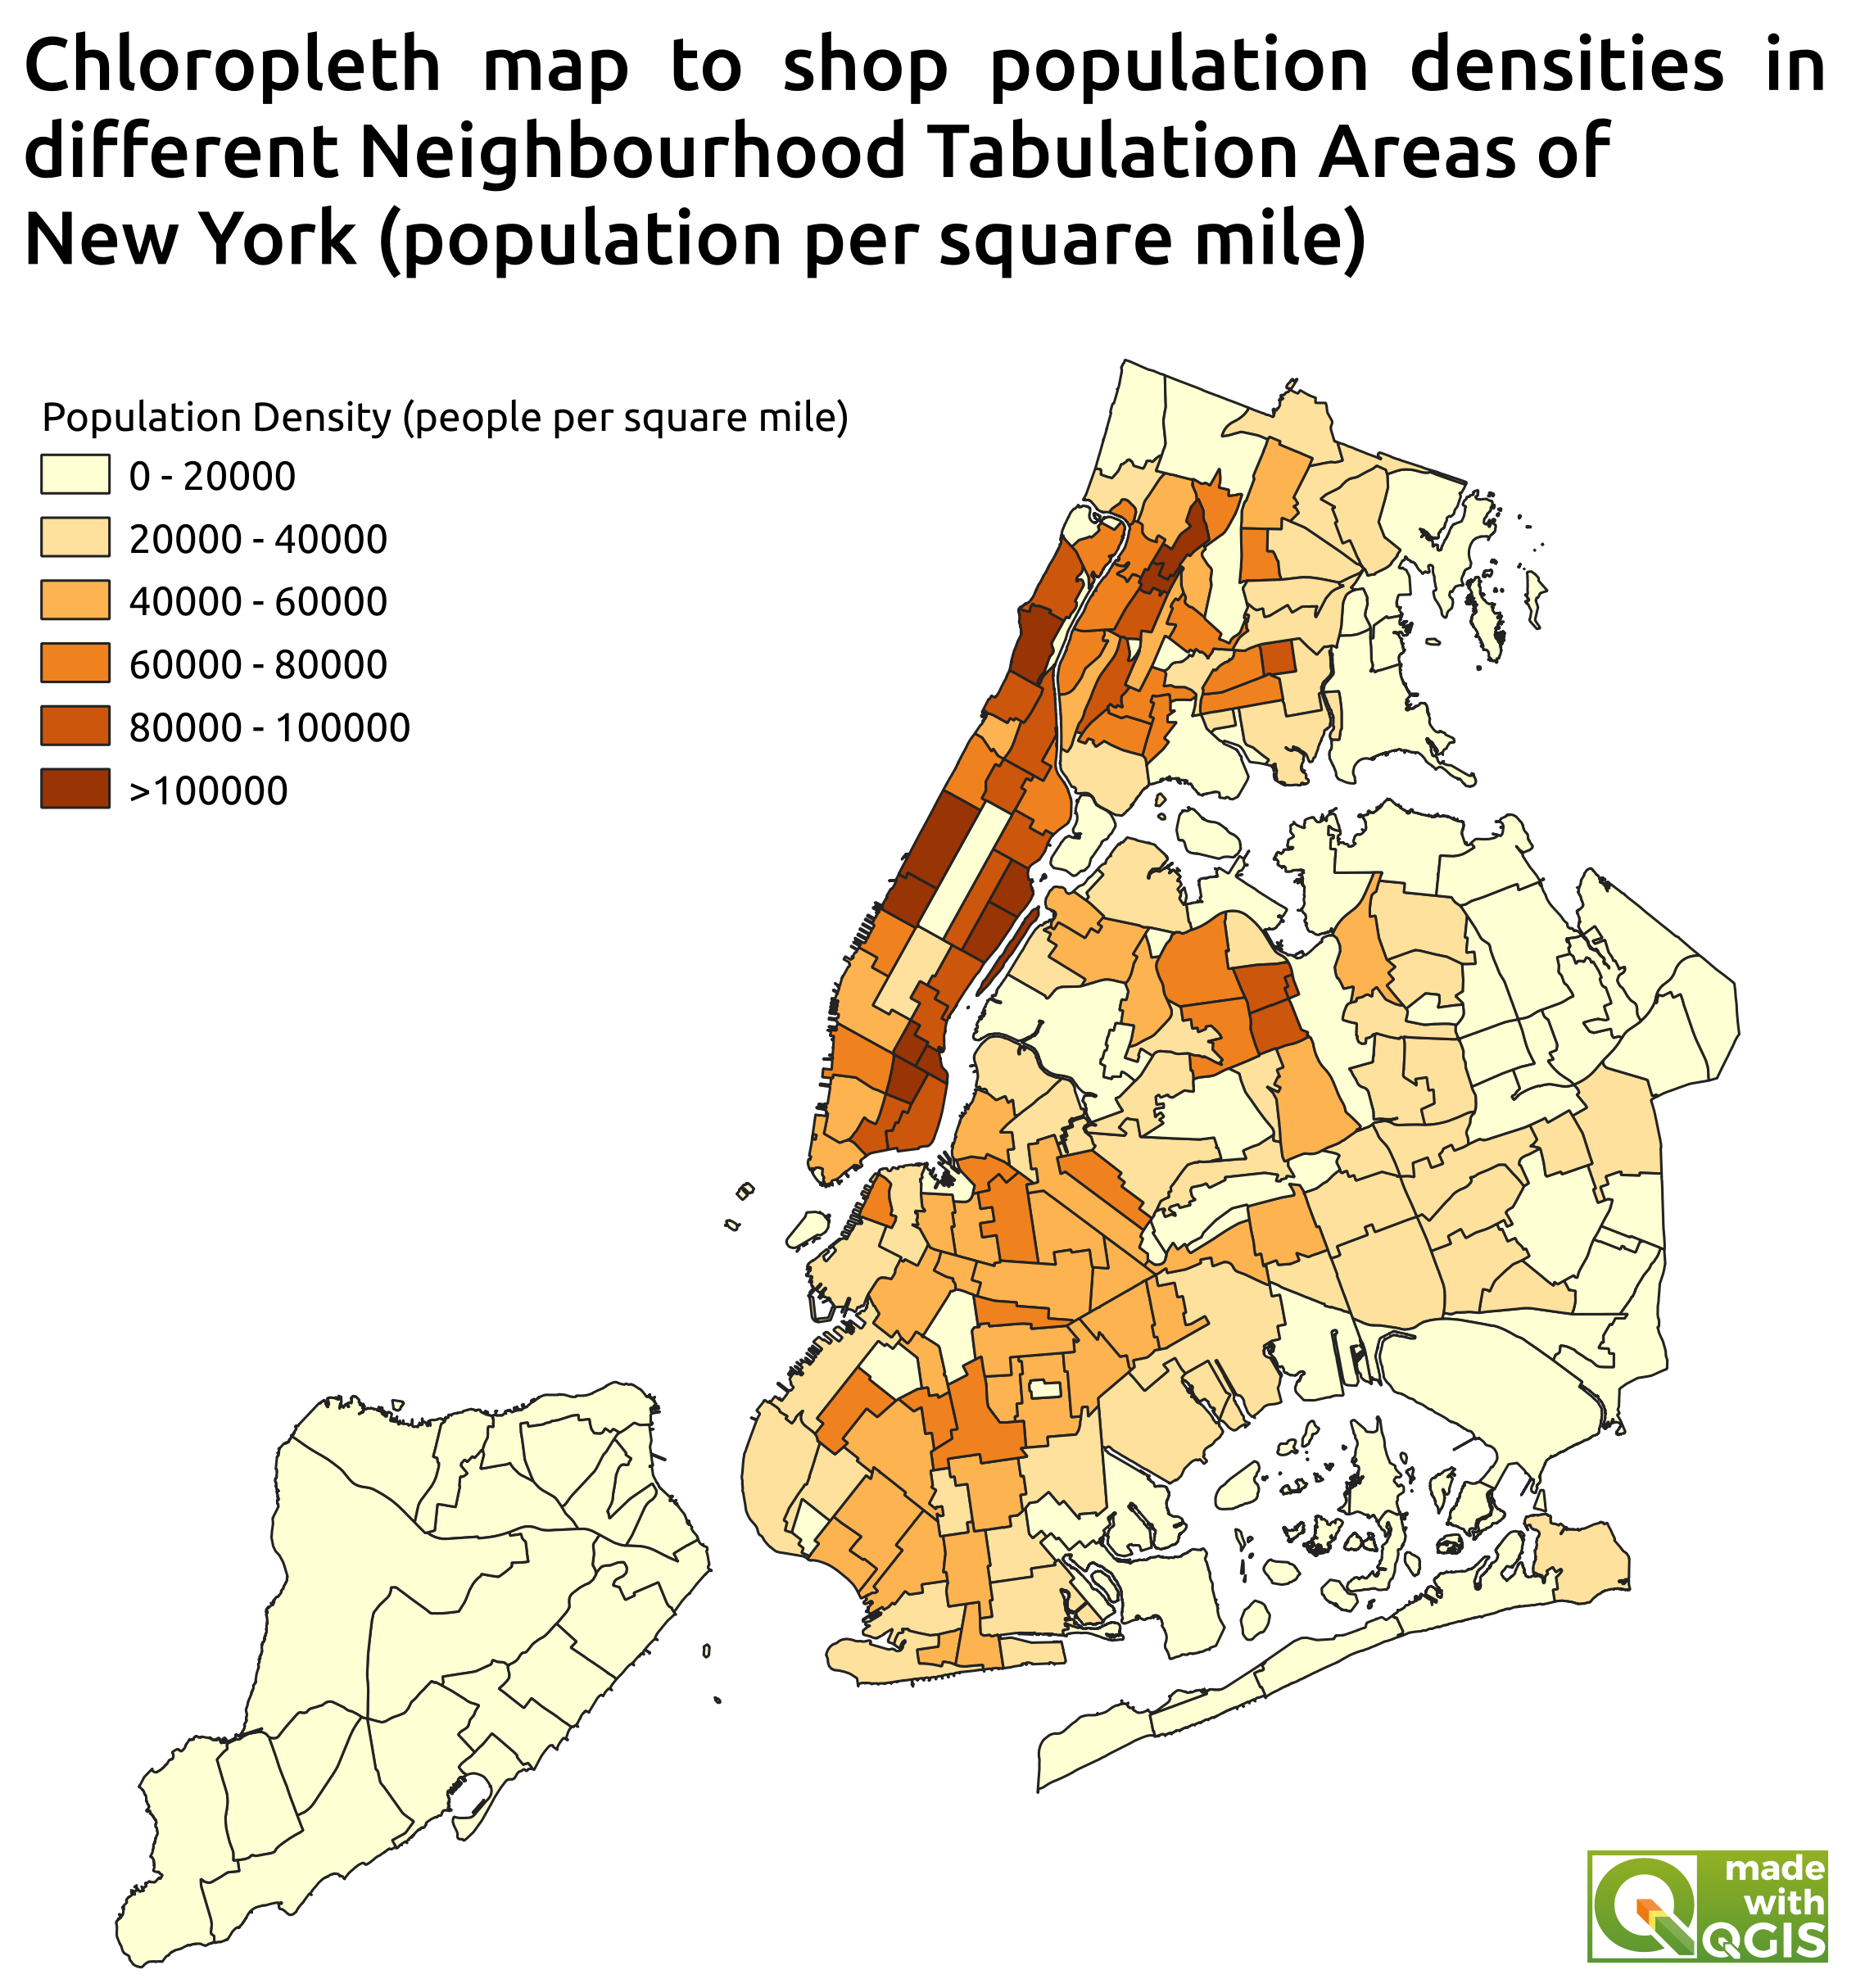
This project was part of the Introduction to QGIS course (Part 2) by Spatial Thoughts. In this section of the course, NYC population data was used in order to acquire knowledge of how to join tables and create chloropleth maps using QGIS. Initally, a vector file containing the neighbourhood areas of New York City was imported alongside a csv file containing information about each of the different neighbourhood populations. Since both tables had a matching primary key (albeit under a different name), the two datasets could be assimilated such that the vector file of the city neighbourhoods also had associated data for population. Since normalisation is required in order to effectively compare neighbourhood populations, population density was calculated per square mile for each neighbourhood area and appended to the table using the tools in the QGIS processing toolbox. Subsequently, a graduated colouration was applied to this layer to signify differences between areas.